frontendmasters
FrontendMasters - Одна из самых лучших площадок для изучения Frontend. Видеокурсы ведут ведущие люди в этой отрасли.
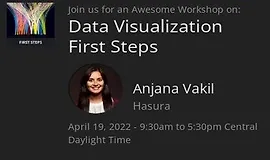
Data Visualization First Steps

Визуализация данных - это гораздо больше, чем рисование красивых диаграмм; это процесс обнаружения и передачи информации, полученной из данных. Как веб-разработчики, мы, к счастью, плаваем в данных о приложениях, которые мы создаем, о пользователях, которые взаимодействуют с ними, и о рабочих процессах разработки, которые мы используем для их создания. Мы можем привыкнуть смотреть на определенные визуализации этих данных — например. простой линейный график или гистограмма, представленные нашей аналитической платформой, но многие разработчики не понимают, что, потратив очень мало времени и усилий, мы можем создавать собственные визуализации, чтобы копать глубже и отвечать на конкретные вопросы, которые действительно важны для нас и нашей работы. .
На этом семинаре в рамках практических проектов мы узнаем, как использовать Plot, библиотеку данных с открытым исходным кодом, и Observable, платформу реактивного кодирования на основе браузера, для быстрого создания проницательных интерактивных визуализаций в JavaScript. После завершения этого семинара у вас будут основные инструменты и методы, необходимые для начала использования dataviz, чтобы лучше понимать свой код, свои проекты и своих пользователей, а также принимать более обоснованные решения в качестве разработчика.

FrontendMasters - Одна из самых лучших площадок для изучения Frontend. Видеокурсы ведут ведущие люди в этой отрасли.